Geo-Targeting Examples: Multiple Data Layers
Geo-targeted mapping merges data from separate and unique sources to create an accurate visual of the location of a targeted audience and the newspapers that reach or do not reach it
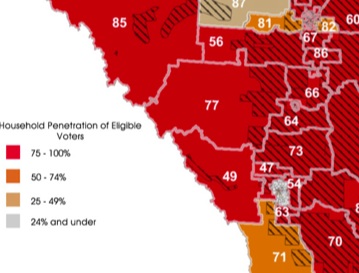
Electoral Districts Coverage Areas and Penetration Percentage
|
|
|
- An agency needed a map showing household newspaper circulation penetration to eligible voters in relation to riding boundaries
- The agency provided us with a list of the boundaries and the criteria for identify the target audience
- Using GIS AdCanada Media system we created a map for circulation penetration by riding for a campaign that aggregated together the coverage areas of all community newspapers in Alberta.
- Shaded areas correspond with the legend in the bottom left hand corner and newspaper circulation areas represented as polygons containing diagonal lines.
- Download PDF to view process details ›
|
|
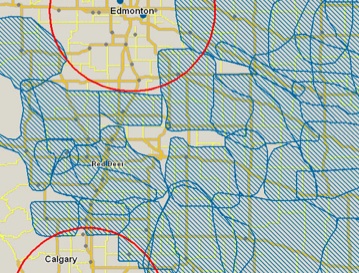
Showing coverage area outside of a specific location radius
|
|
|
- The agency for an online electronics retailer defines the target as being more than 150kms from a major centre.
- Based on the criteria supplied by the agency we created a map showing the circulation of the relevant newspapers to their target audience
- AdCanada Media's GIS system was used to create a map that layered relevant publications outside of the radius areas
- Download PDF to view process details ›
|
|
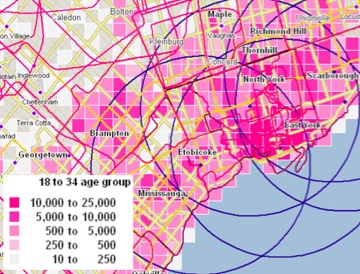
Density Map for multi location coverage area within specific distance grids
|
|
|
- The agency for a popular chain of fast food restaurants defines their target market as being 18-34 years old and living within 10km of a restaurant location.
- Using a AdWest GIS system, StatsCan population data was thematically mapped using a grid technique to isolate the concentration of the target.
- Concentric circles were added to shed light on the target radius
along with applicable third party audited coverage areas to confirm the best media options.
- Download PDF to view process details ›
|
|
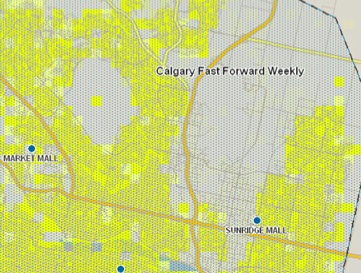
Population Density Coverage Area and Retail Locations
|
|
|
- The agency for a retail client located primarily in shopping malls, needed store locations plotted against the coverage area of FFWD Weekly and StatsCan population density information.
- The FSI campaign needed to be concentrated in the areas of the publication distribution serving heavily populated districts.
- One of the surprises was that the unpopulated area in the northeast quadrant of the coverage area, turned out to be light industrial
- Download PDF to view process details ›
|
|
Overlaying Retail Locations, Crop Production and Crop Districts
|
|
|
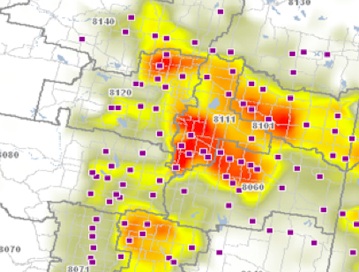
- The agency supplied Census Agglomeration areas as their primary geographic planning criteria for a large agricultural chemical manufacturer
- Using AdCanada Media GIS system, the CA's were integrated with StatsCan Ag Census data for canola production density, represented here by using thermal imaging mapping and consumer data.
- Newspaper coverage areas were not included in this map but instead were added to the supporting raw data tables to show circulation by CA, acres of Canola produced and customer count by coverage footprint.
- Download PDF to view process details ›
|
|
Overlaying target communities with district coverage areas
|
|
|
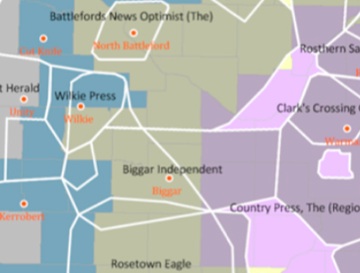
- Agency supplied target geography integrated with coverage areas and key communities.
- Sure they did but what did you do....
- more info... hopefully...
- Download PDF to view process details ›
|
|


